

In this blog post we explain how to monitor for any topological changes in your network by running a single command. The technique requires no extra software to be added to your devices. The monitoring is nearly instantaneous (less than 1s delay). The monitoring occurs over a reliable transport, but without the overhead and queuing delay of TCP. The monitoring can be authenticated and the monitoring can be easily automated. Sounds too good to be true ?, then read on…
Normally to monitor a set of routers an agent is required to be installed on each router. Traditionally this has been SNMP, more recently it may be NETCONF. NETCONF, including NETCONF notifications, are sent over TCP which gives a reliable transport. Reliable is better than unreliable right ? Well not when your network is in meltdown. Under major failure conditions the last thing you want to do is queue the latest state updates behind old out of date updates. SNMP having been designed when network links were less reliable, made the correct choice and used UDP. TCP is a good choice if you want to collect long term telemetry data to show you the trends in your network. UDP is the right choice if you want to know the state of your network right now.
However, if your network is running OSPF (or IS-IS) then you already have the complete current topology of your network in each router. This topology is built using OSPF LSA’s, which are flooded reliably over raw IP (i.e. no TCP or UDP encapsulation overhead). The information you see is accurate, because it is the OSPF LSA’s that are used to build the routers route table (RIB). The only delay is the sub-second delay it takes to flood updated LSA’s. OSPF LSA flooding is reliable, but only the latest information is flooded. So you get a reliable service without the delays involved in queuing. Even under network meltdown you are going to see exactly how the network is melting down! And when the dust has settled you can have an exact log of the changes that caused the outage.
OSPF Topology LSA’s
OSPF has various LSA types, but only two of them are used by the router to derive the current topology of the network. The first type is the Router LSA which contains a list of active networks the router currently has a connection to. The second type is the Network LSA which contains a list of active routers on a network. Each router originates its own Router-LSA. The Designated Router on each network originates the Network LSA for that network.
These LSA’s are reliably flooded, and each router stores them in its Link State Database. Since Router LSA’s list the networks each router is connected to, and each network has a Network LSA that list all the routers it is connected to, the router can build the topology of the network. So if we track Router LSA’s and Network LSA’s, then our management system can also track the topology of the network, for free.
Worked Example
To demonstrate how we can track the topology in practice let’s use the example network shown below.
- R01-R05 are all in OSPF Area 0
- R01-R04 can be from any vendor. The LSA formats are defined in RFC2328 and so cannot vary by vendor.
- R05 is a flock networks router so we can easily interrogate the OSPF link state database.
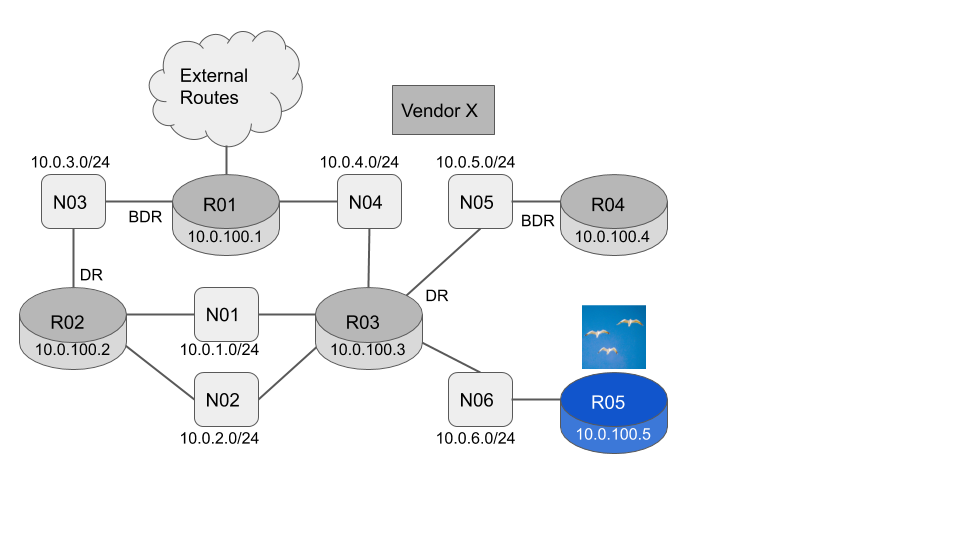
The current link state database consists of five Router LSA’s (one originated by each router) and six Network LSA’s (one originated by the Designated Router for each network)
flock@R05:~$ flockrsc ospfv2 -l -a 0
{"lsa_age":241,"lsa_opts":{"bits":2},"lsa_type":"Router","lsa_id":"10.0.100.1","lsa_router_id":"10.0.100.1","lsa_seq":"0x80000008","lsa_checksum":"0x256e","lsa_len":72}
{"lsa_age":241,"lsa_opts":{"bits":2},"lsa_type":"Router","lsa_id":"10.0.100.2","lsa_router_id":"10.0.100.2","lsa_seq":"0x80000006","lsa_checksum":"0xd669","lsa_len":60}
{"lsa_age":242,"lsa_opts":{"bits":2},"lsa_type":"Router","lsa_id":"10.0.100.3","lsa_router_id":"10.0.100.3","lsa_seq":"0x8000000a","lsa_checksum":"0x7f05","lsa_len":84}
{"lsa_age":240,"lsa_opts":{"bits":2},"lsa_type":"Router","lsa_id":"10.0.100.4","lsa_router_id":"10.0.100.4","lsa_seq":"0x80000002","lsa_checksum":"0x9814","lsa_len":36}
{"lsa_age":246,"lsa_opts":{"bits":2},"lsa_type":"Router","lsa_id":"10.0.100.5","lsa_router_id":"10.0.100.5","lsa_seq":"0x80000002","lsa_checksum":"0x7462","lsa_len":36}
{"lsa_age":251,"lsa_opts":{"bits":2},"lsa_type":"Network","lsa_id":"10.0.3.157","lsa_router_id":"10.0.100.2","lsa_seq":"0x80000002","lsa_checksum":"0x658","lsa_len":32}
{"lsa_age":242,"lsa_opts":{"bits":2},"lsa_type":"Network","lsa_id":"10.0.1.246","lsa_router_id":"10.0.100.3","lsa_seq":"0x80000003","lsa_checksum":"0xe81","lsa_len":36}
{"lsa_age":242,"lsa_opts":{"bits":2},"lsa_type":"Network","lsa_id":"10.0.2.213","lsa_router_id":"10.0.100.3","lsa_seq":"0x80000002","lsa_checksum":"0xf033","lsa_len":32}
{"lsa_age":242,"lsa_opts":{"bits":2},"lsa_type":"Network","lsa_id":"10.0.4.152","lsa_router_id":"10.0.100.3","lsa_seq":"0x80000002","lsa_checksum":"0x312f","lsa_len":32}
{"lsa_age":240,"lsa_opts":{"bits":2},"lsa_type":"Network","lsa_id":"10.0.5.204","lsa_router_id":"10.0.100.4","lsa_seq":"0x80000002","lsa_checksum":"0x3cea","lsa_len":32}
{"lsa_age":246,"lsa_opts":{"bits":2},"lsa_type":"Network","lsa_id":"10.0.6.181","lsa_router_id":"10.0.100.5","lsa_seq":"0x80000002","lsa_checksum":"0x1c1f","lsa_len":32}
Create a baseline snapshot of the LSA’s
To monitor the network we are going to look for changes in the LSA’s. When the network is in a known good state, we want to record the LSA’s. Some fields in the LSA are expected to change even when the network is stable. The LSA age (lsa_age) field is an estimate of the LSA’s age in seconds since it was originated. It will obviously increment every second. LSA’s are refreshed every 30 minutes by the router that originated them. As part of the refresh the LSA sequence number (lsa_seq) is incremented. The LSA sequence number is covered by the LSA checksum (lsa_checksum), so the checksum is recalculated as part of the LSA refresh. We want to ignore changes in these fields as they are expected in a stable network.
To remove the lsa_age, lsa_seq and lsa_checksum fields, we will first display the LSA’s in a JSON print pretty format using the -j command line option. (In the following command -l means Link State Database and -a 0 means Area 0).
flock@R05:~$ flockrsc ospfv2 -l -a 0 -j
[
  {
    "lsa_age": 24,
    "lsa_opts": {
      "bits": 2
    },
    "lsa_type": "Router",
    "lsa_id": "10.0.100.1",
    "lsa_router_id": "10.0.100.1",
    "lsa_seq": "0x80000009",
    "lsa_checksum": "0x236f",
    "lsa_len": 72
  },
...
And then remove the volatile fields using an inverted grep.
flock@R05:~$ flockrsc ospfv2 -l -a 0 -j | grep -v -E 'lsa_age|lsa_seq|lsa_checksum'
[
  {
    "lsa_opts": {
      "bits": 2
    },
    "lsa_type": "Router",
    "lsa_id": "10.0.100.1",
    "lsa_router_id": "10.0.100.1",
    "lsa_len": 72
  },
...
Now we add the -d detail flag to also output the LSA body. We do not expect any fields in the LSA body to change, as that would indicate a real network change. We can now generate our baseline JSON.
flock@R05:~$ flockrsc ospfv2 -l -a 0 -j -d | grep -v -E 'lsa_age|lsa_seq|lsa_checksum' > baseline.jsonIf your network is stable you can wait as long as you like and then compare outputs and they will be identical.
flock@R05:~$ flockrsc ospfv2 -l -a 0 -j -d | grep -v -E 'lsa_age|lsa_seq|lsa_checksum' > now.json
flock@R05:~$ diff baseline.json now.json
flock@R05:~$
If you see any output (differences) this is a change in the network topology and should be investigated.
Compare the expected baseline against the current network state
Now let’s simulate a failure by powering down R04.
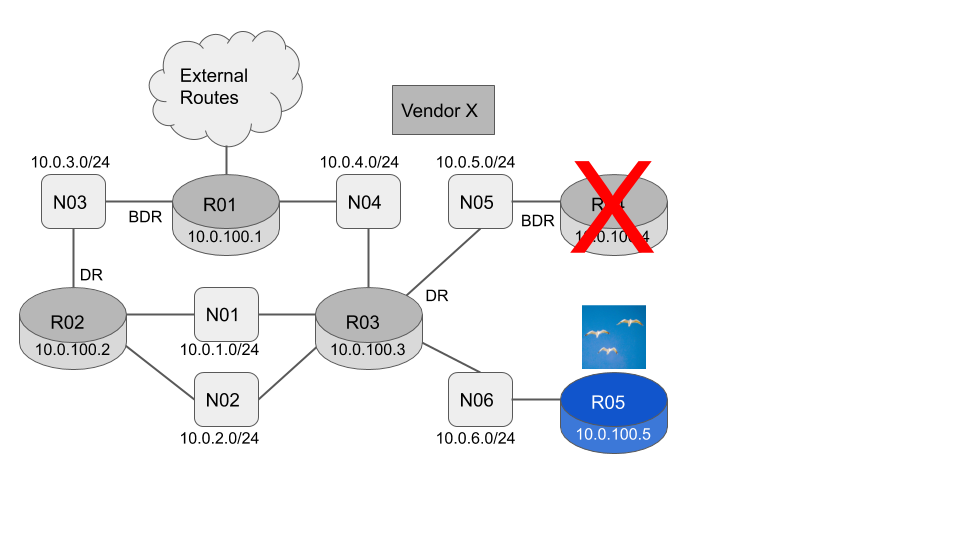
We take a snapshot of the LSA’s now and compare them against our expected baseline.
flock@R05:~$ flockrsc ospfv2 -l -a 0 -j -d | grep -v -E 'lsa_age|lsa_seq|lsa_checksum' > now.json
flock@R05:~$ diff baseline.json now.json
131,133c131,133
<             "link_id": "10.0.5.225",
<             "link_data": "10.0.5.225",
<             "link_type": "Transit",
---
>             "link_id": "10.0.5.0",
>             "link_data": "255.255.255.0",
>             "link_type": "Stub",
333c333
<       "lsa_len": 32
---
>       "lsa_len": 28
340,341c340
<             "10.0.100.3",
<             "10.0.100.4"
---
>             "10.0.100.3"
We can see at line 131 R03 has originated an updated Router Lsa, showing that the N05 link has changed from a transit network to a stub network. This is telling us that R03 is now the only active router on N05.
We can see at line 340 R03 has originated an updated Network LSA for the N05 network, showing that R04 is no longer listed as an active router.
If we now power R04 back up, we expect the network to return to its original good state.
flock@R05:~$ flockrsc ospfv2 -l -a 0 -j -d | grep -v -E 'lsa_age|lsa_seq|lsa_checksum' > now.json
flock@R05:~$ diff baseline.json now.json
flock@R05:~$
This technique will catch all topology changes. For instance if the L2 switch forming N03 fails then R02 will remove / flush the N03 Network LSA. R01 and R02 will each originate a new Router LSA with the N03 link missing.
The stability of external routes can be monitored in exactly the same way by monitoring the AS External LSA’s. AS External LSA’s can be viewed by looking at the AS level Link State Database flockrsc ospfv2 -l -j -d.
You could easily automate this technique and take snapshots at whatever intervals you require. You could set an alert if the output from the diff command is not empty. You could also use this technique before and after a planned network upgrade. If you are expecting a new router to be installed, then you will expect to see a new Router LSA. If you are just upgrading the speed of the links between the routers, then you will expect no differences.
Unlock your network using the Flock Networks Routing Suite
Most of the internal state of a Flock Networks Router can be viewed in JSON format. If a machine is connecting the output can be in raw JSON. The connection is Read-Only so no state can be changed in the router. This means the connecting user / process requires no special privileges.
An identical technique to the one described above can be used to monitor;
- Any route updates in the RIB
- The current reachability of the networks OSPF ABR’s and ASBR’s
- Any local OSPF neighbor state changes
- Any local routing protocol interface packet drops
- Any system interface state / IP Address changes
You can download the Flock Networks Routing Suite for free here.
If you would like any other internal router state available via the JSON interface, please email support@flocknetworks.com.
Nick