As we come to the end of this phase of our performance and scale testing, we have turned our attention to the Flock Networks Operations REST API.
Flock Networks routing suite v20.3.5 is out now and it can sort and serialize the 763k BGP routes (as seen at LINX) into JSON and then stream them over HTTP in under 2s.
you@your-host:~$ time flockc bgp --prefix --host 192.168.101.194 > bgp_table.json
real    0m1.972s
you@your-host:~$ wc bgp_table.json
   763307    763307 223051579 bgp_table.json
Because BGP routes have so much meta data (BGP path attributes etc) that is 223 MB of data.
 you@your-host:~$ ls -l bgp_table.json
 -rw-r--r-- 1 you you 223051579 Sep 30 09:51 bgp_table.json
If we are feeling a bit crazy we can now diff the internet backbone in real time !
The Flock Networks Routing Suite has excellent observability because all operational state queries can be returned in JSON format using a machine friendly API.
More information on using the Operations REST API can be found here. The software can be downloaded from here.
In a previous blog post we showed how to use a single Flock Networks Router to monitor your entire network, using the OSPF Link State Database. In this blog post we demonstrate a technique to monitor your network, using the client, application and language of your choice.
Users of the Flock Networks Routing Suite have been telling us that they like the network status information being presented in a JSON format. However it is frustrating not being able to easily get that information off the router. Ethan Banks was kind enough to live stream his first use of the Flock Networks Routing Suite. Ethan talks about wanting a remote monitoring API here. We have listened to this feedback, and Flock Networks Routing Suite version 20.0.4 now implements a REST API.
The REST API returns a JSON payload inside HTTP. Combining these two widely used standards allows the API to talk to a huge variety of clients. The REST API is by design Read-Only, you can view the network state but cannot change it. In HTTP terms this means the only HTTP method that is supported is GET.
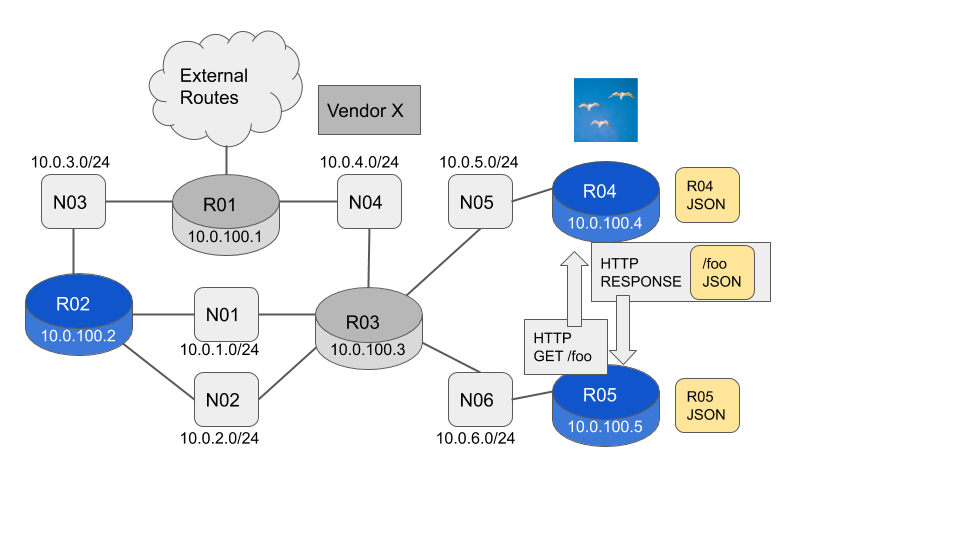
Monitor using a Router
Routers R02, R04 and R05 are Flock Network Routers. By using one router, say R05, you can monitor the others.
To see the local state we use the existing client connection. This is a local Unix Domain Socket delivering a JSON payload.
To see the remote state we just add a --host <host-name / host-ip> option to the command. This is a remote connection using HTTP delivering a JSON payload. The JSON payload has an identical format to the payload returned by the local command.
There is no summarization in this network, so we expect all routers to have the same routes in the RIB. We can check this using the same technique we used in the previous blog post. We store the information we expect to be identical into a text file, then compare the text files for each router.
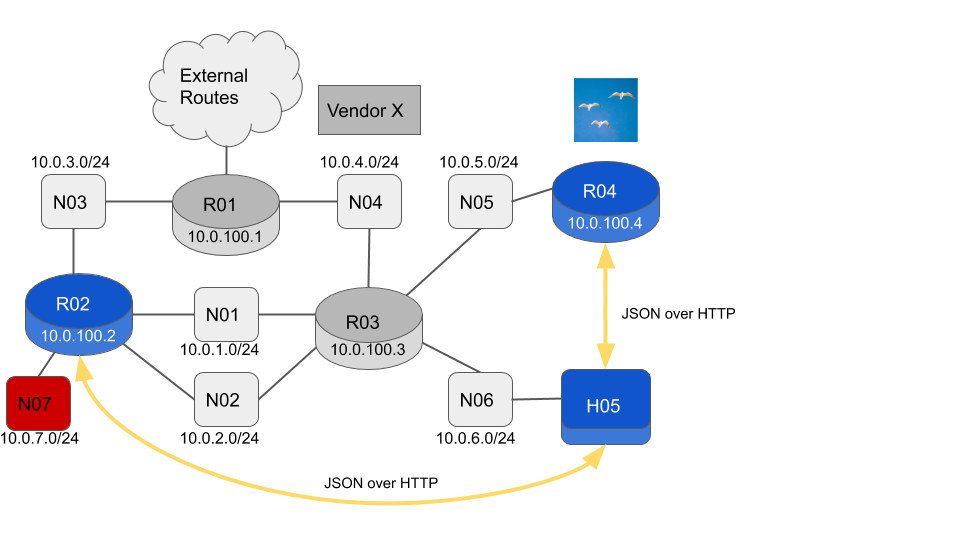
We have converted R05 from a router into a host H05. A new L3 Network N07 has been installed connected to R02.
The Flock Networks Routing Suite client is now available on its own. We can convert R05 into a host by removing the Routing Suite Daemon and installing the Client package.
flock@R05:~$ sudo systemctl stop flockrsd
flock@R05:~$ sudo dpkg --purge flockrsd
(Reading database ... 27722 files and directories currently installed.)
Removing flockrsd (20.0.4) ...
Purging configuration files for flockrsd (20.0.4) ...
flock@R05:~$ sudo dpkg -i flockrsc_20.0.4_amd64.deb
Selecting previously unselected package flockrsc.
(Reading database ... 27717 files and directories currently installed.)
Preparing to unpack flockrsc_20.0.4_amd64.deb ...
Unpacking flockrsc (20.0.4) ...
Setting up flockrsc (20.0.4) ...
flock@R05:~$
H05 is no longer running any routing code, but can still monitor the network using the REST API. Since we are now a host rather than a router, we need to add a default route via R03.
flock@H05:~$ sudo ip route add 0.0.0.0/0 via 10.0.6.189 dev enp1s0
Let’s check that the RIB’s in R02 and R04 are consistent.
So R02 has the N07 subnet but R04 does not. It looks like the new network N07 might not be being advertised in OSPF. Let’s check which interfaces on R02 are enabled for OSPFv2.
The interface connecting to N07 10.0.7.0/24 is not listed. Let’s check the newly live interface is in a good state (it probably is as we have already seen a RIB entry for it).
Yes it is there, it’s name is “enp9s0” and it is Up. Let’s use ssh to look at the OSPFv2 config on R02.
    flock@H05:~$ ssh flock@R02 'cat /etc/flockrsd/ospfv2.toml'
    [ospf_v2]
    router_id = "10.0.100.2"
    [[ospf_v2.area]]
    area_id = "0.0.0.0"
    [[ospf_v2.area.intf]]
    name = "enp1s0"
    [[ospf_v2.area.intf]]
    name = "enp7s0"
    [[ospf_v2.area.intf]]
    name = "enp8s0"
And yes, we are missing the entry for “enp9s0”. Let’s ssh over to R02 and correct the OSPFv2 configuration. After that we can run our original RIB consistency test again, and we should get no diffs.
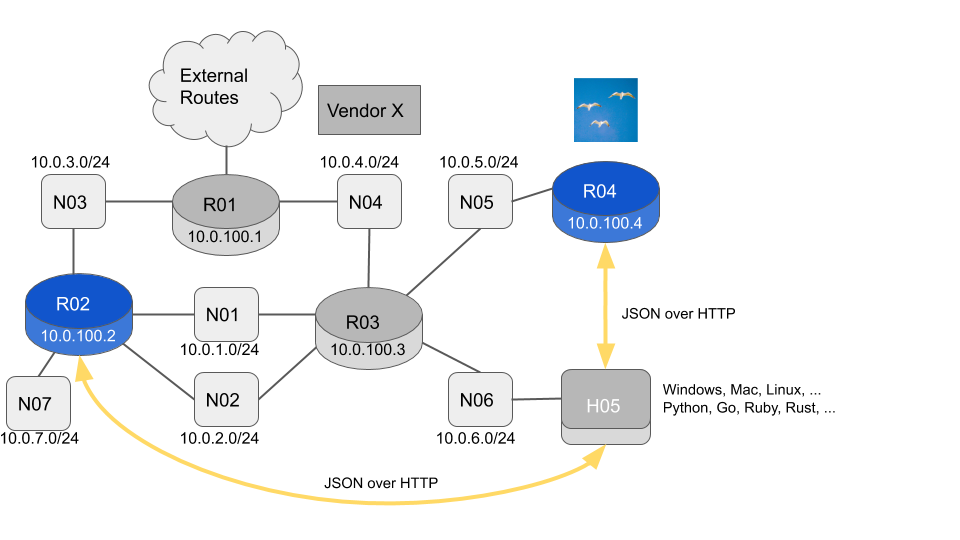
H05 has been swapped out for any host of your choice.
The Operating System on H05 can be pretty much anything you like. You can choose which application to use to connect to the REST API. You can choose which language you want to use to process the network information.
Let’s choose curl as our application to connect to the REST API. It runs on pretty much every Operating System out there. Say we want to get the OSPFv2 Area 0 Link State Database from R04 and use it as input for a Python program. The command to get this information from the Flock Client would be:
Note that we have added a --json option. The output is going to be fed into Python, so we want vanilla JSON, not the Flock Client default which is JSONL (JSON with extra newlines to help human readability).
If we add the --show-url option to any Flock Client command, it will display the REST URL that it would connect to, and then exit without attempting to actually connect.
flock@H05:~$ flockrsc ospfv2 --area 0 --lsdb --host R04 --json --show-url
REST API URL would be 'http://R04:8000/ospfv2/area?area_id=0.0.0.0/lsdb/json'
flock@H05:~$
We can then tell curl to HTTP GET from this URL and pipe the output into Python.
And that’s it. You now have complete visibility into your network. You have the network information in a structured format. You can use any tooling you like to operate on that information. Put on your Dev Ops hat and go forth and create !
More information on the REST API can be found here. The Flock Routing Suite can be downloaded for free from here.
If you have any feature requests, feedback etc, please email ‘support@flocknetworks.com’.
In this blog post we explain how to monitor for any topological changes in your network by running a single command. The technique requires no extra software to be added to your devices. The monitoring is nearly instantaneous (less than 1s delay). The monitoring occurs over a reliable transport, but without the overhead and queuing delay of TCP. The monitoring can be authenticated and the monitoring can be easily automated. Sounds too good to be true ?, then read on…
Normally to monitor a set of routers an agent is required to be installed on each router. Traditionally this has been SNMP, more recently it may be NETCONF. NETCONF, including NETCONF notifications, are sent over TCP which gives a reliable transport. Reliable is better than unreliable right ? Well not when your network is in meltdown. Under major failure conditions the last thing you want to do is queue the latest state updates behind old out of date updates. SNMP having been designed when network links were less reliable, made the correct choice and used UDP. TCP is a good choice if you want to collect long term telemetry data to show you the trends in your network. UDP is the right choice if you want to know the state of your network right now.
However, if your network is running OSPF (or IS-IS) then you already have the complete current topology of your network in each router. This topology is built using OSPF LSA’s, which are flooded reliably over raw IP (i.e. no TCP or UDP encapsulation overhead). The information you see is accurate, because it is the OSPF LSA’s that are used to build the routers route table (RIB). The only delay is the sub-second delay it takes to flood updated LSA’s. OSPF LSA flooding is reliable, but only the latest information is flooded. So you get a reliable service without the delays involved in queuing. Even under network meltdown you are going to see exactly how the network is melting down! And when the dust has settled you can have an exact log of the changes that caused the outage.
OSPF Topology LSA’s
OSPF has various LSA types, but only two of them are used by the router to derive the current topology of the network. The first type is the Router LSA which contains a list of active networks the router currently has a connection to. The second type is the Network LSA which contains a list of active routers on a network. Each router originates its own Router-LSA. The Designated Router on each network originates the Network LSA for that network.
These LSA’s are reliably flooded, and each router stores them in its Link State Database. Since Router LSA’s list the networks each router is connected to, and each network has a Network LSA that list all the routers it is connected to, the router can build the topology of the network. So if we track Router LSA’s and Network LSA’s, then our management system can also track the topology of the network, for free.
Worked Example
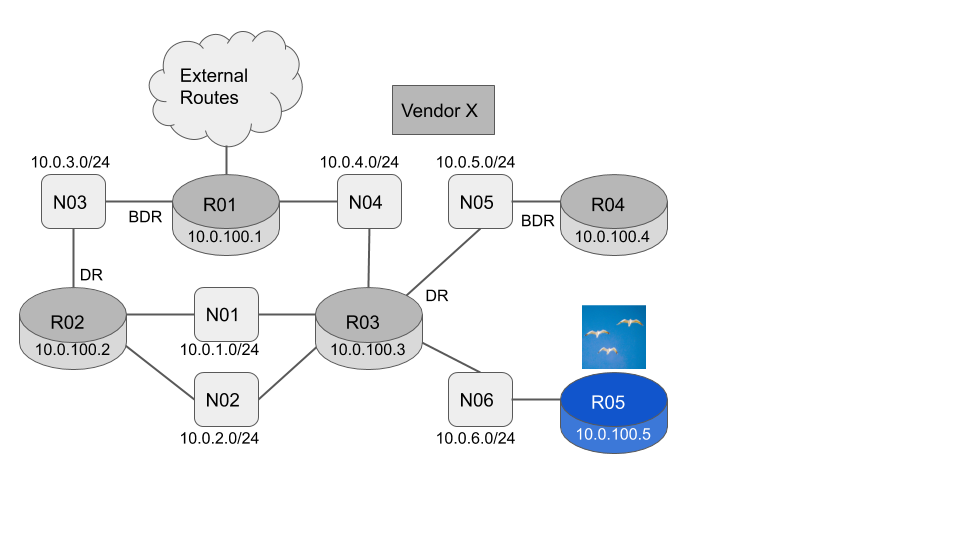
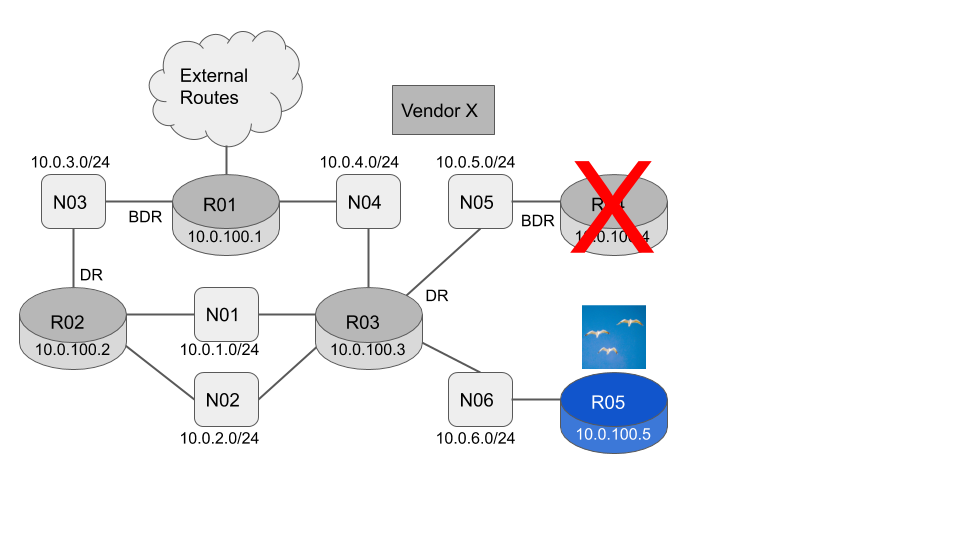
To demonstrate how we can track the topology in practice let’s use the example network shown below.
R01-R05 are all in OSPF Area 0
R01-R04 can be from any vendor. The LSA formats are defined in RFC2328 and so cannot vary by vendor.
R05 is a flock networks router so we can easily interrogate the OSPF link state database.
The current link state database consists of five Router LSA’s (one originated by each router) and six Network LSA’s (one originated by the Designated Router for each network)
To monitor the network we are going to look for changes in the LSA’s. When the network is in a known good state, we want to record the LSA’s. Some fields in the LSA are expected to change even when the network is stable. The LSA age (lsa_age) field is an estimate of the LSA’s age in seconds since it was originated. It will obviously increment every second. LSA’s are refreshed every 30 minutes by the router that originated them. As part of the refresh the LSA sequence number (lsa_seq) is incremented. The LSA sequence number is covered by the LSA checksum (lsa_checksum), so the checksum is recalculated as part of the LSA refresh. We want to ignore changes in these fields as they are expected in a stable network.
To remove the lsa_age, lsa_seq and lsa_checksum fields, we will first display the LSA’s in a JSON print pretty format using the -j command line option. (In the following command -l means Link State Database and -a 0 means Area 0).
Now we add the -d detail flag to also output the LSA body. We do not expect any fields in the LSA body to change, as that would indicate a real network change. We can now generate our baseline JSON.
We can see at line 131 R03 has originated an updated Router Lsa, showing that the N05 link has changed from a transit network to a stub network. This is telling us that R03 is now the only active router on N05.
We can see at line 340 R03 has originated an updated Network LSA for the N05 network, showing that R04 is no longer listed as an active router.
If we now power R04 back up, we expect the network to return to its original good state.
This technique will catch all topology changes. For instance if the L2 switch forming N03 fails then R02 will remove / flush the N03 Network LSA. R01 and R02 will each originate a new Router LSA with the N03 link missing.
The stability of external routes can be monitored in exactly the same way by monitoring the AS External LSA’s. AS External LSA’s can be viewed by looking at the AS level Link State Database flockrsc ospfv2 -l -j -d.
You could easily automate this technique and take snapshots at whatever intervals you require. You could set an alert if the output from the diff command is not empty. You could also use this technique before and after a planned network upgrade. If you are expecting a new router to be installed, then you will expect to see a new Router LSA. If you are just upgrading the speed of the links between the routers, then you will expect no differences.
Unlock your network using the Flock Networks Routing Suite
Most of the internal state of a Flock Networks Router can be viewed in JSON format. If a machine is connecting the output can be in raw JSON. The connection is Read-Only so no state can be changed in the router. This means the connecting user / process requires no special privileges.
An identical technique to the one described above can be used to monitor;
Any route updates in the RIB
The current reachability of the networks OSPF ABR’s and ASBR’s
Any local OSPF neighbor state changes
Any local routing protocol interface packet drops
Any system interface state / IP Address changes
You can download the Flock Networks Routing Suite for free here.
If you would like any other internal router state available via the JSON interface, please email support@flocknetworks.com.
This question fits in the same category as “How long is a piece of string ?”. The answer is of course, “it depends”.
Back in 1998 whilst working for a router vendor, I was helping design a backbone network for a European ISP. Our web site was recommending a maximum of 40 – 60 routers per OSPF area, but the customer was designing for 180 in a single backbone area. The network was deployed and went live fine. I was curious as to how it would perform over the long term, so 6 months later I contacted the customers operations team for an update. (If you want to verify a network design, then there are few better ways than asking the Operations team. If there have been problems at 2am, you will definitely get some candid feedback). The customers operations team said the network was stable, and were happy with its performance. So the “official” 40 – 60 routers per area recommendation looked pretty conservative.
Today, if you google the title of this blog, the top hit says an area should have no more than 50 routers. That is from a design guide written in 2011. So over the 13 years from 1998 to 2011 the recommendation had surprisingly not increased. Now it’s almost 2020. 22 years later, what can we expect ?
Networking in 2020
Being a Link State protocol OSPF will consume as much CPU and Bandwidth as it needs until the network is converged. After that, whilst the network is stable, a good implementation will sit idle except for sending periodic hello’s to its neighbours. So (WAN) link stability will have a large impact on how well OSPF scales. We can probably assume that WAN links today are more stable than WAN links in 1998 [citation needed]. Anyway lets be conservative and assume they are no worse.
The critical resources OSPF needs are CPU to run the SPF algorithm, and CPU / Bandwidth to flood the LSA’s. Back in 1998 the Route Processors in the customers network used a 667 MHz Power PC CPU and the WAN links were either 2.5G (STM-16) or 10G (STM-64).
Over the 22 years from 1998-2020, Moore’s law states the CPU transistor count doubles every 2 years. Due to the increased transistor count the performance is expected to double around every 18 months. So the performance should have doubled around 14 times. In terms of CPU we should be able to support 180 x 2^14 = ~~3 million routers per area !
The lowest bandwidth link in the customer network in 1998 was 2.5G. In 2020 we can expect ISP backbones to be provisioned at 40G and 100G. So this is a much more modest 40/2.5 = 16X speedup. In terms of bandwidth for flooding LSA’s we should be able to support 180 x 16 = ~~3000 routers per area.
So in 2020, in theory you can have up to 3000 routers in a single area, in practice maybe not so much. Complex systems scale in surprising ways that are hard to model. But in 2020 OSPF should easily be able to scale to the 100’s of routers per area.
What if ?
What if we created a modern implementation of OSPF, developed with 21st Century Hardware in mind ?
What if the SPF Algorithm, the Link State Database and the Flood Queues used cache friendly data structures, so the CPU spends less time idling waiting for data ?
What if all incoming signalling was processed before running SPF and servicing the LSA flood queues ?
What if the OSPF route table remembered all the paths it has computed, rather than just the best ?
What if you could transfer 10,000 routes from OSPF to the RIB by moving an 8 byte pointer, rather than copying a gadzillion bytes between processes using IPC ?
What if the RIB only signalled the forwarding plane when a route had really changed, rather than when some route meta data had changed that the forwarding plane has no interest in ?
What if I stopped asking all these annoying “what if” questions and got to the point ?
In 1Q 2020 Flock Networks are shipping Routing Suite v20.0. If you would like to:
Be part of the early field trials.
Deploy over 1000 routers in a single OSPF area and not have the expected result being your vendor saying “You did what ?”
Save power by running a routing suite that mostly sleeps once the network is converged.
Gain observability into your existing OSPF network using a Read-Only JSON API.
Then please email eft@flocknetworks.com.
In the mean time here’s wishing everyone a Happy Solstice and a converged and stable 2020. If you are short of gift ideas I can highly recommend the book what if ?
Nick
We use cookies on our website. By clicking “Accept”, you consent to the use of all cookies.
This website uses cookies to improve your experience while you navigate through the website. Out of these, the cookies that are categorized as necessary are stored on your browser as they are essential for the working of basic functionalities of the website. We also use third-party cookies that help us analyze and understand how you use this website. These cookies will be stored in your browser only with your consent. You also have the option to opt-out of these cookies. But opting out of some of these cookies may affect your browsing experience.
Necessary cookies are absolutely essential for the website to function properly. This category only includes cookies that ensures basic functionalities and security features of the website. These cookies do not store any personal information.
Any cookies that may not be particularly necessary for the website to function and is used specifically to collect user personal data via analytics, ads, other embedded contents are termed as non-necessary cookies. It is mandatory to procure user consent prior to running these cookies on your website.